This chapter introduces the Invoice Monitoring dashboard and its functionalities. It explains how to use the dashboard to monitor invoicing activities, identify anomalies, and ensure everything is running smoothly. You will learn how to navigate the dashboard, interpret the data, and customize the monitoring levels to suit your needs.
User Rights
- 3176 Menu - Invoice Monitoring (to view)
- 3175 Menu - Invoice Monitoring Alert levels (to edit alert levels)
About The Invoice Monitoring Dashboard
The Invoice Monitoring dashboard helps users responsible for invoicing to have a good overall view of the system status and it can help spot anomalies in interfaces, charges, and invoices. This view helps to identify situations, where something is out of the ordinary in a simple, color-coded way.
The invoice monitoring dashboard offers a single dashboard, with traffic light styling, so that you can immediately see a summary of the desired time frame in interfaces, charges, and invoicing. The full functionality consists of the organization tree (providing the option to filter data on organization level) and a dashboard which has two tabs; one for viewing the data (Invoice Monitoring) and one for maintaining the used calculation levels (Monitoring Levels).
The parameters can even be set manually, so that you can survey your invoicing data easily and as precisely as you like.
How To Use Invoice Monitoring
The Invoice Monitoring dashboard can be found under Reporting (provided you have one or both of the required user rights)
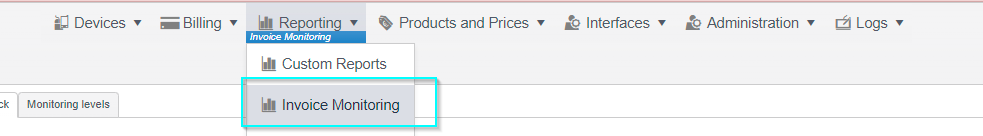
Figure 1: Finding Invoice Monitoring in the Navigation
The dashboard consists of a monitoring view of three main segments: Interfaces, Charges, and Invoices. Each section provides more detailed information from More details, and Charges and Invoices can be drilled down even further.
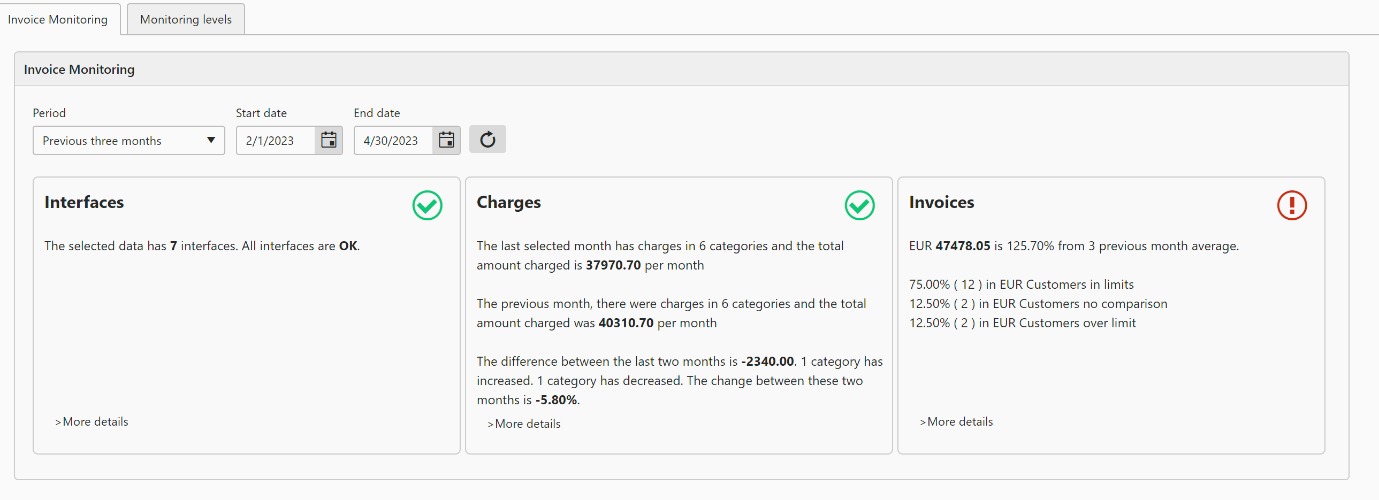
Figure 2: Invoice Monitoring Dashboard
The Invoice Monitor can be used to search data by selecting one of the predefined periods or by manually selecting your own with Start date and End date fields.
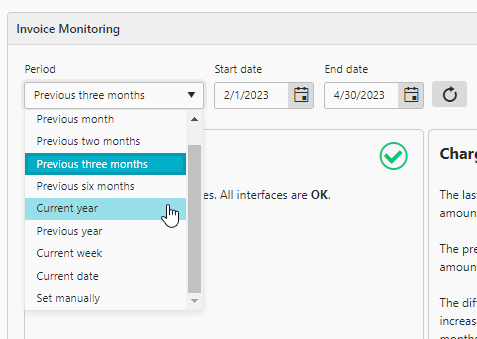
Figure 3: Period selection
Interfaces
The Interfaces section provides an overview of your Interfaces and highlights errors:

Figure 4: Interfaces section of the dashboard
Charges
Charges section gives you a summary of the charges created for the selected time period, and More details displays a product category level details (which can be viewed either in Grid or Chart format)

Figure 5: Charges section of the dashboard
By selecting one of the Product categories in the list, you can drill down to product level information:

Figure 6: Sample view
Invoices
The Invoices tab shows the overall situation regarding invoices. For example, what has been the invoicing average per currency the previous 3 months.
By selecting More details and choosing the invoicing currency you wish to investigate, you can see the customer level information for the selected time period.
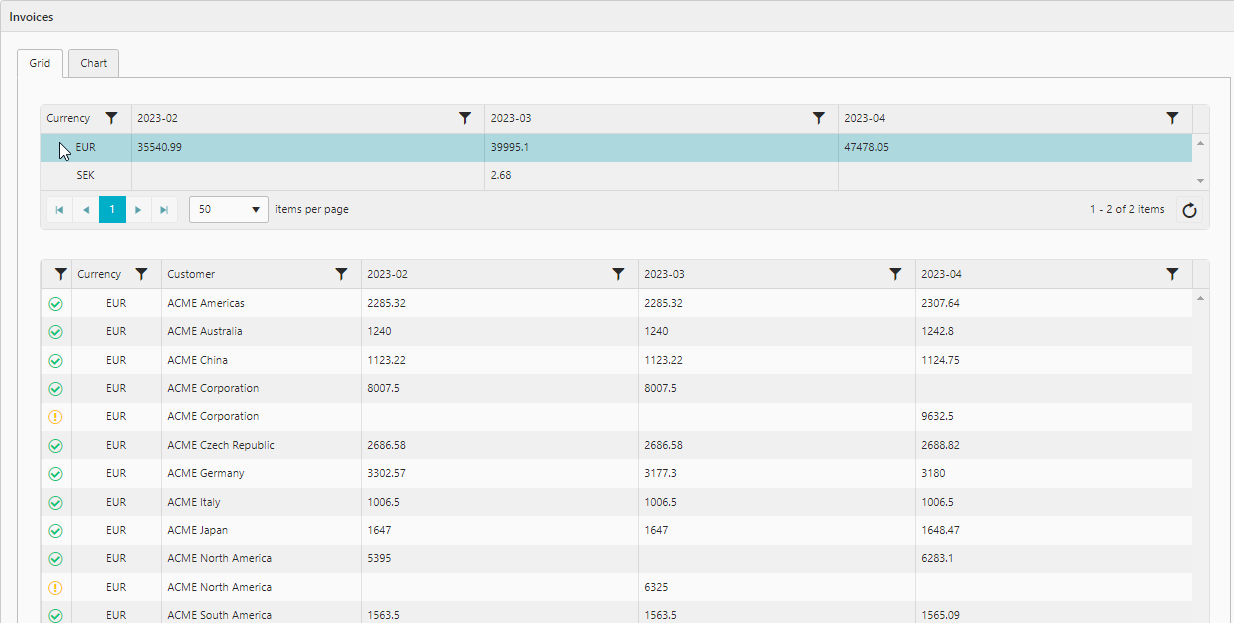
Figure 7: Invoices view
AI Prediction
The AI Prediction tab provides a forward-looking forecast of future invoicing using historical billing data and AI‑powered analysis. This helps identify upcoming trends, seasonal patterns, and potential anomalies before they impact your invoicing.
This feature analyzes the previous 24 months (configurable) of invoicing for the selected customer and produces a 12‑month forecast, including both graphical and written insights.
Where to Find AI Prediction
The AI Prediction tab is located inside Invoice Monitoring.
- New navigation:
Organizations → Select customer → Reporting → Invoice Monitoring → AI Prediction - Old navigation:
Reporting → Invoice Monitoring → AI Prediction
You will see the tab only if your user profile includes the required rights.
User Rights
To access Invoice Monitoring and the AI Prediction tab, two rights are required:
- 3176 Menu – Invoice Monitoring — grants access to the Invoice Monitoring page itself. Without this right, the menu item does not appear in the navigation and the page is unreachable.
- 3179 Menu – AI Prediction — grants access to the AI Prediction tab within Invoice Monitoring. This right alone is not sufficient; 3176 must also be enabled.
By default, both rights are included in the following user profiles:
- Admin
- Invoicing Specialist
Note: A third right, 3175 Menu – Invoice Monitoring Alert levels, controls access to alert level configuration. Check with your administrator whether this is needed for your use case.
What You Will See in the AI Prediction Tab
The AI Prediction view includes:
- Forecast chart
A visual monthly prediction for the next 12 months, based on historical invoicing patterns. - AI‑generated analysis
A written explanation describing expected trends, drivers behind increases or decreases, and risk factors. - Anomaly information
If the system detects unusual patterns, these are highlighted with explanations. - Summary details
Includes the analysis timeframe, used model, and disclaimers.

Figure 8: AI Prediction tab in Invoice Monitoring
How to Use AI Prediction
- Select a customer from the organization tree.
- Open the Invoice Monitoring dashboard.
- Navigate to the AI Prediction tab.
- Review the chart and written explanation.
- Use the insight to validate expectations, detect risks, and support planning decisions.
Notes and Limitations
- If required system settings are missing, the tab will display:
“AI configuration incomplete.”
Contact your Good Sign administrator if this occurs. - Forecast quality depends on the availability and stability of historical invoicing data.
- AI Prediction is enabled by default for cloud environments.
Monitoring Levels
Organization selection allows customizing, whether the same monitoring levels would be applied for the whole organization hierarchy or if there are different ones for another organization or organization hierarchy. However, for the sake of clarity, it is recommended to keep the same values for all.
Setting tells which of the three segments is being adjusted and value is percentages. In the image below you see the default values.
Examples on how to interpret settings:
- Interface alerts as yellow if more than 95 percent of interfaces are running ok and have no issues.
- Charges alert as red if the money amount on charges is 20% less (-20) or 20% (20) more than in the last two months
- Invoices alert as yellow if the sum differs maximum of 10% (+ or -) of the three month average
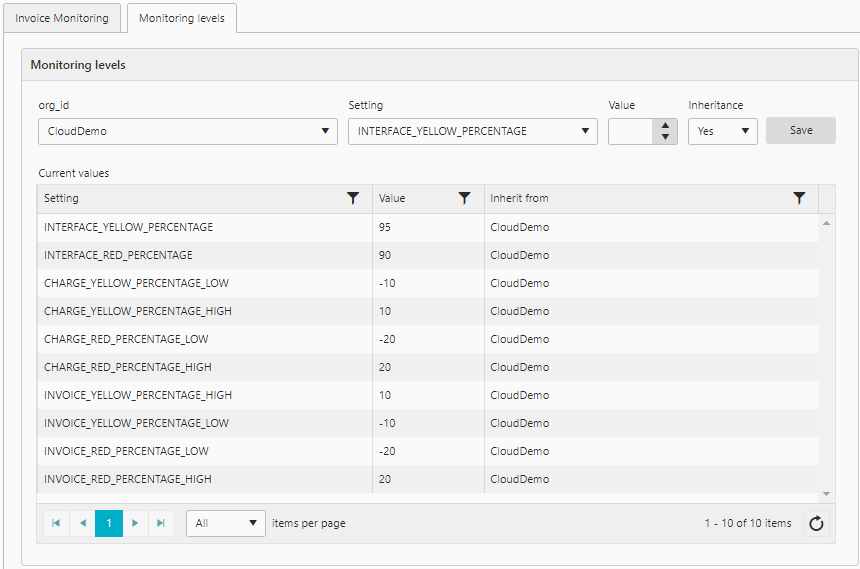
Figure 9: Monitoring levels view