A guide about the Invoice Monitoring Dashboard
Required User Rights
To use the functionalities discussed in this guide, you’ll need at least the following user rights: 3176 Menu - Invoice Monitoring, and 3175 Menu - Invoice Monitoring Alert levels.
About The Invoice Monitoring Dashboard
The Invoice Monitoring dashboard helps users responsible for invoicing to have a good overall view of the system status and it can help to spot anomalies in interfaces, charges, and invoices. This solution helps to identify situations, where something is out of the ordinary in a very simple, color-coded way.
The invoice monitoring dashboard offers a single dashboard, with traffic light styling, so that you can immediately see a summary of the desired time frame in interfaces, charges, and invoicing. The full functionality consists of the organization tree (providing the option to filter data on organization level) and a dashboard which has two tabs; one for viewing the data (Invoice Monitoring) and one for maintaining the used calculation levels (Monitoring Levels).
The parameters can even be set manually, so that you can survey your invoicing data easily and as precisely as you like.
Invoice Monitoring
The Invoice Monitoring dashboard can be found in Reporting > Invoice Monitoring:
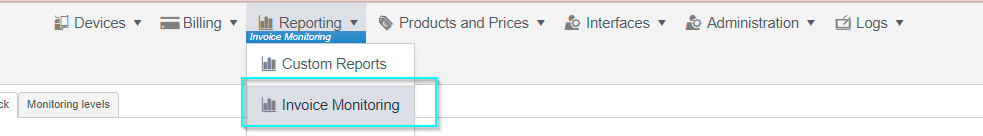
Figure 1: Reporting > Invoice Monitoring
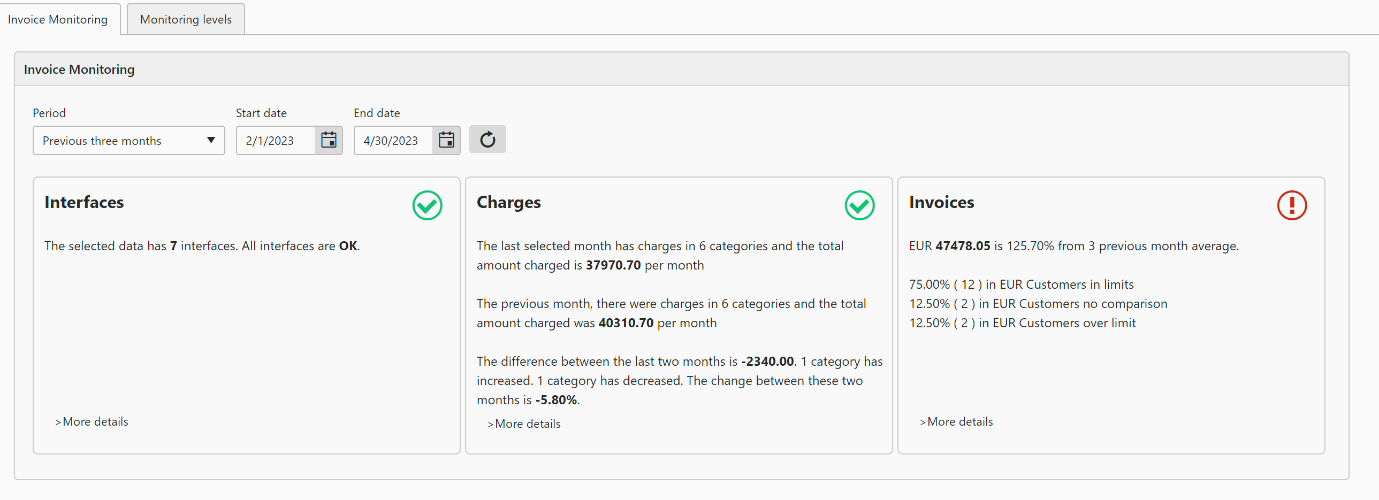
Figure 2: The Invoice Monitor
The Invoice Monitor can be used to search data from different periods:
- Previous year
- Current year
- Previous 6, 3, 2, or 1 month(s)
- Current month
- Current week
- A manually set date frame
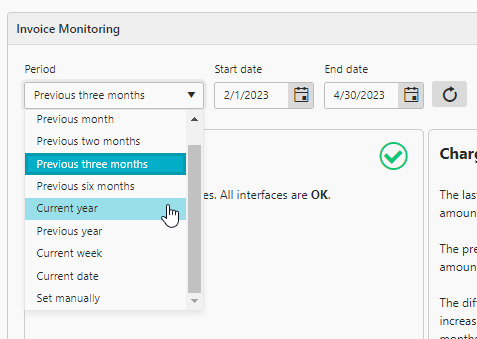
Figure 3: Period setting
Interfaces

Figure 4: Interfaces
The Interfaces tab allows you to see if all the interfaces in your current setup are working properly.

Figure 5: Interfaces > More details
By selecting the More details, more details will open up below the tab about the subject.
Charges
The Charges tab shows the situation in charges for the desired time period. For example, you can see what charges have been created and what’s the total amount that the charges have created in currency. By selecting More details, you can see more information about the selected period’s charges.

Figure 6: Charges > More details

Figure 7: Invoice Monitoring > Charges > More details grid
The data in this window is organized by Product Category. By clicking a product, another view opens below with detailed product codes and details of that specific product category.
The Charges tab also has another tab available to view data in chart form:

Figure 8: Charges > Chart
Invoices
The Invoices tab shows the overall situation regarding invoices. For example, what has been the invoicing average per currency the previous 3 months.
By selecting More details
in the Invoices section, you can see the invoice details in either grid form or as a chart.
First you choose the invoicing currency you wish to investigate:
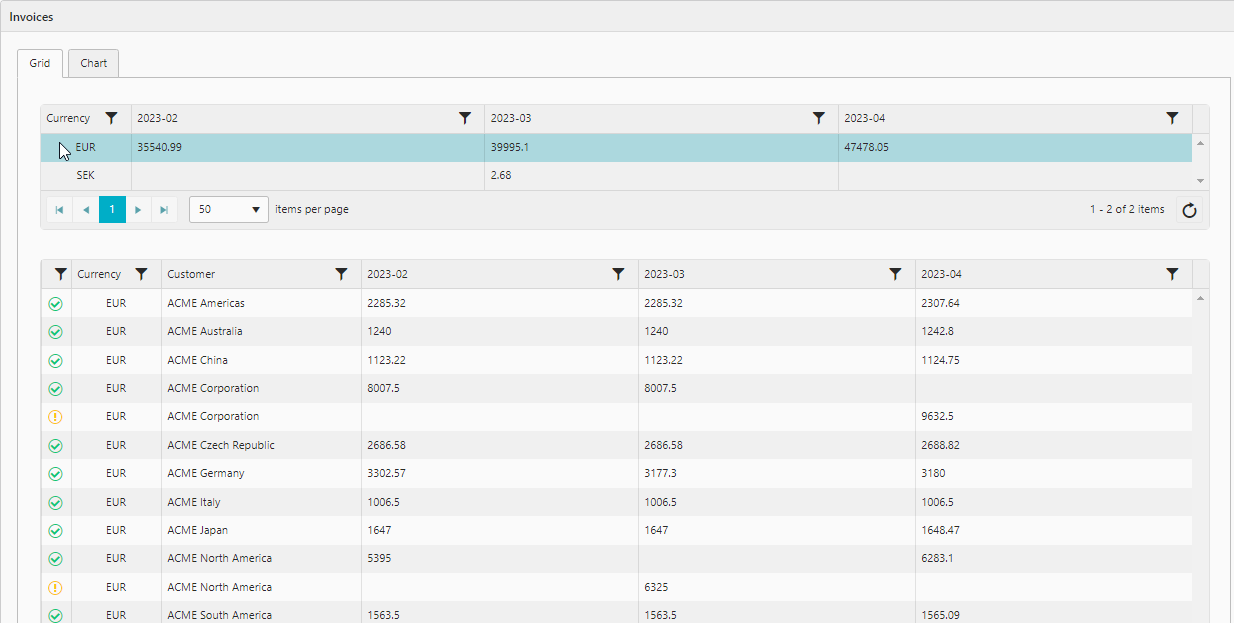
Figure 10: Invoices > More Details about invoices in EUR
For example, in the picture above, the user has selected to view more details of their EUR invoicing data in grid form. By activating the EUR row, the user is able to see the company’s invoicing data for the selected time period that has taken place in euros.
Invoice details also allow to view the information in chart form:
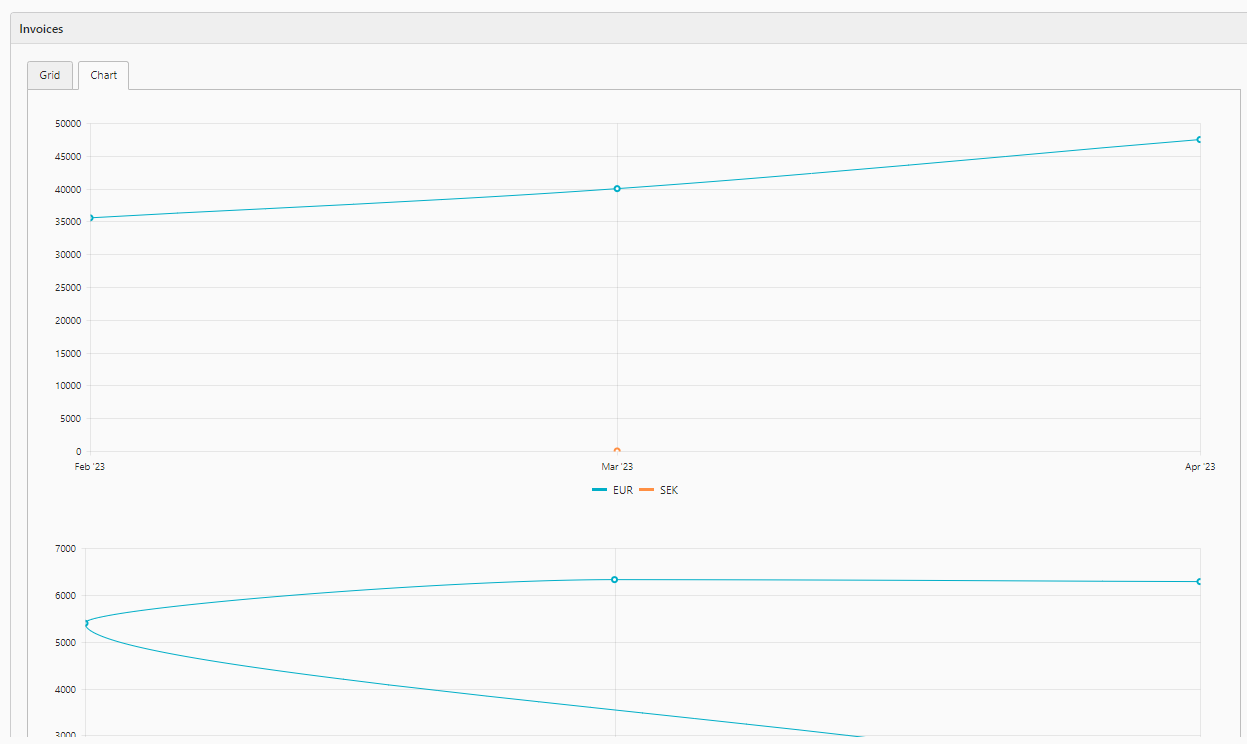
Figure 11: Invoices > Chart Monitoring Levels
The different invoice monitoring levels can be set (or changed) from the Monitoring levels tab.
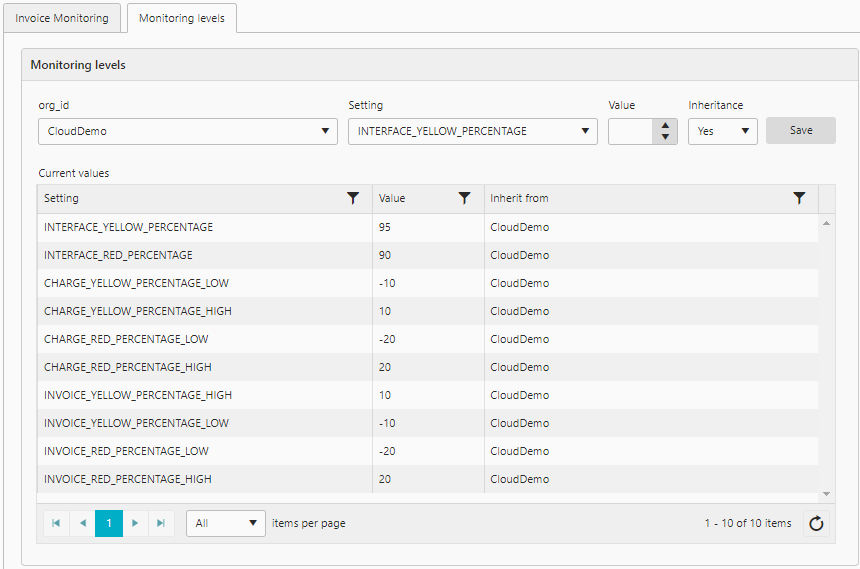
Figure 12: Monitoring Levels setup
Organization selection allows customizing, whether the same monitoring levels would be applied for the whole organization hierarchy or if there are different ones for another organization or organization hierarchy.
The Settings that can be modified:
- INTERFACE_YELLOW_PERCENTAGE – Sets up the yellow marking level in the interface report. The default value is 95 %. The calculation is done by dividing the number of non-operational interfaces by the total number of interfaces
- INTERFACE_RED_PERCENTAGE – Sets up the red marking level in the interface report. The default value 90%. The calculation is done by dividing the number of non-operational interfaces by the total number of interfaces
- CHARGE_YELLOW_PERCENTAGE_LOW – Sets up the minimum yellow level in the Charges report. The default value is -10%. The value describes the percentual difference in charges in the last two months
- CHARGE_YELLOW_PERCENTAGE_HIGH – Sets up the maximum yellow level in the Charges report. The default value is +10%. The value describes the percentual difference in charges in the last two months
- CHARGE_RED_PERCENTAGE_LOW – Sets up the minimum red level in the Charges report. The default value is -20%. The value describes the percentual difference in charges in the last two months
- CHARGE_RED_PERCENTAGE_HIGH – Sets up the maximum red level in the Charges report. The default value is +20%. The value describes the percentual difference in charges in the last two months
- INVOICE_YELLOW_PERCENTAGE_LOW – Sets up the minimum yellow level in the Invoice report. The default value is -10%. The value describes the percentual difference in invoices in the last three months
- INVOICE_YELLOW_PERCENTAGE_HIGH – Sets up the maximum yellow level in the Invoice report. The default value is +10%. The value describes the percentual difference in invoices in the last three months
- INVOICE_RED_PERCENTAGE_LOW – Sets up the minimum red level in the Invoice report. The default value is -20%. The value describes the percentual difference in invoices in the last three months
- INVOICE_RED_PERCENTAGE_HIGH – Sets up the maximum red level in the Invoice report. The default value is +20%. The value describes the percentual difference in invoices in the last three months